Work / Frame 16 — Voice of Customer Dashboard16 of 16
Voice of Customer Dashboard
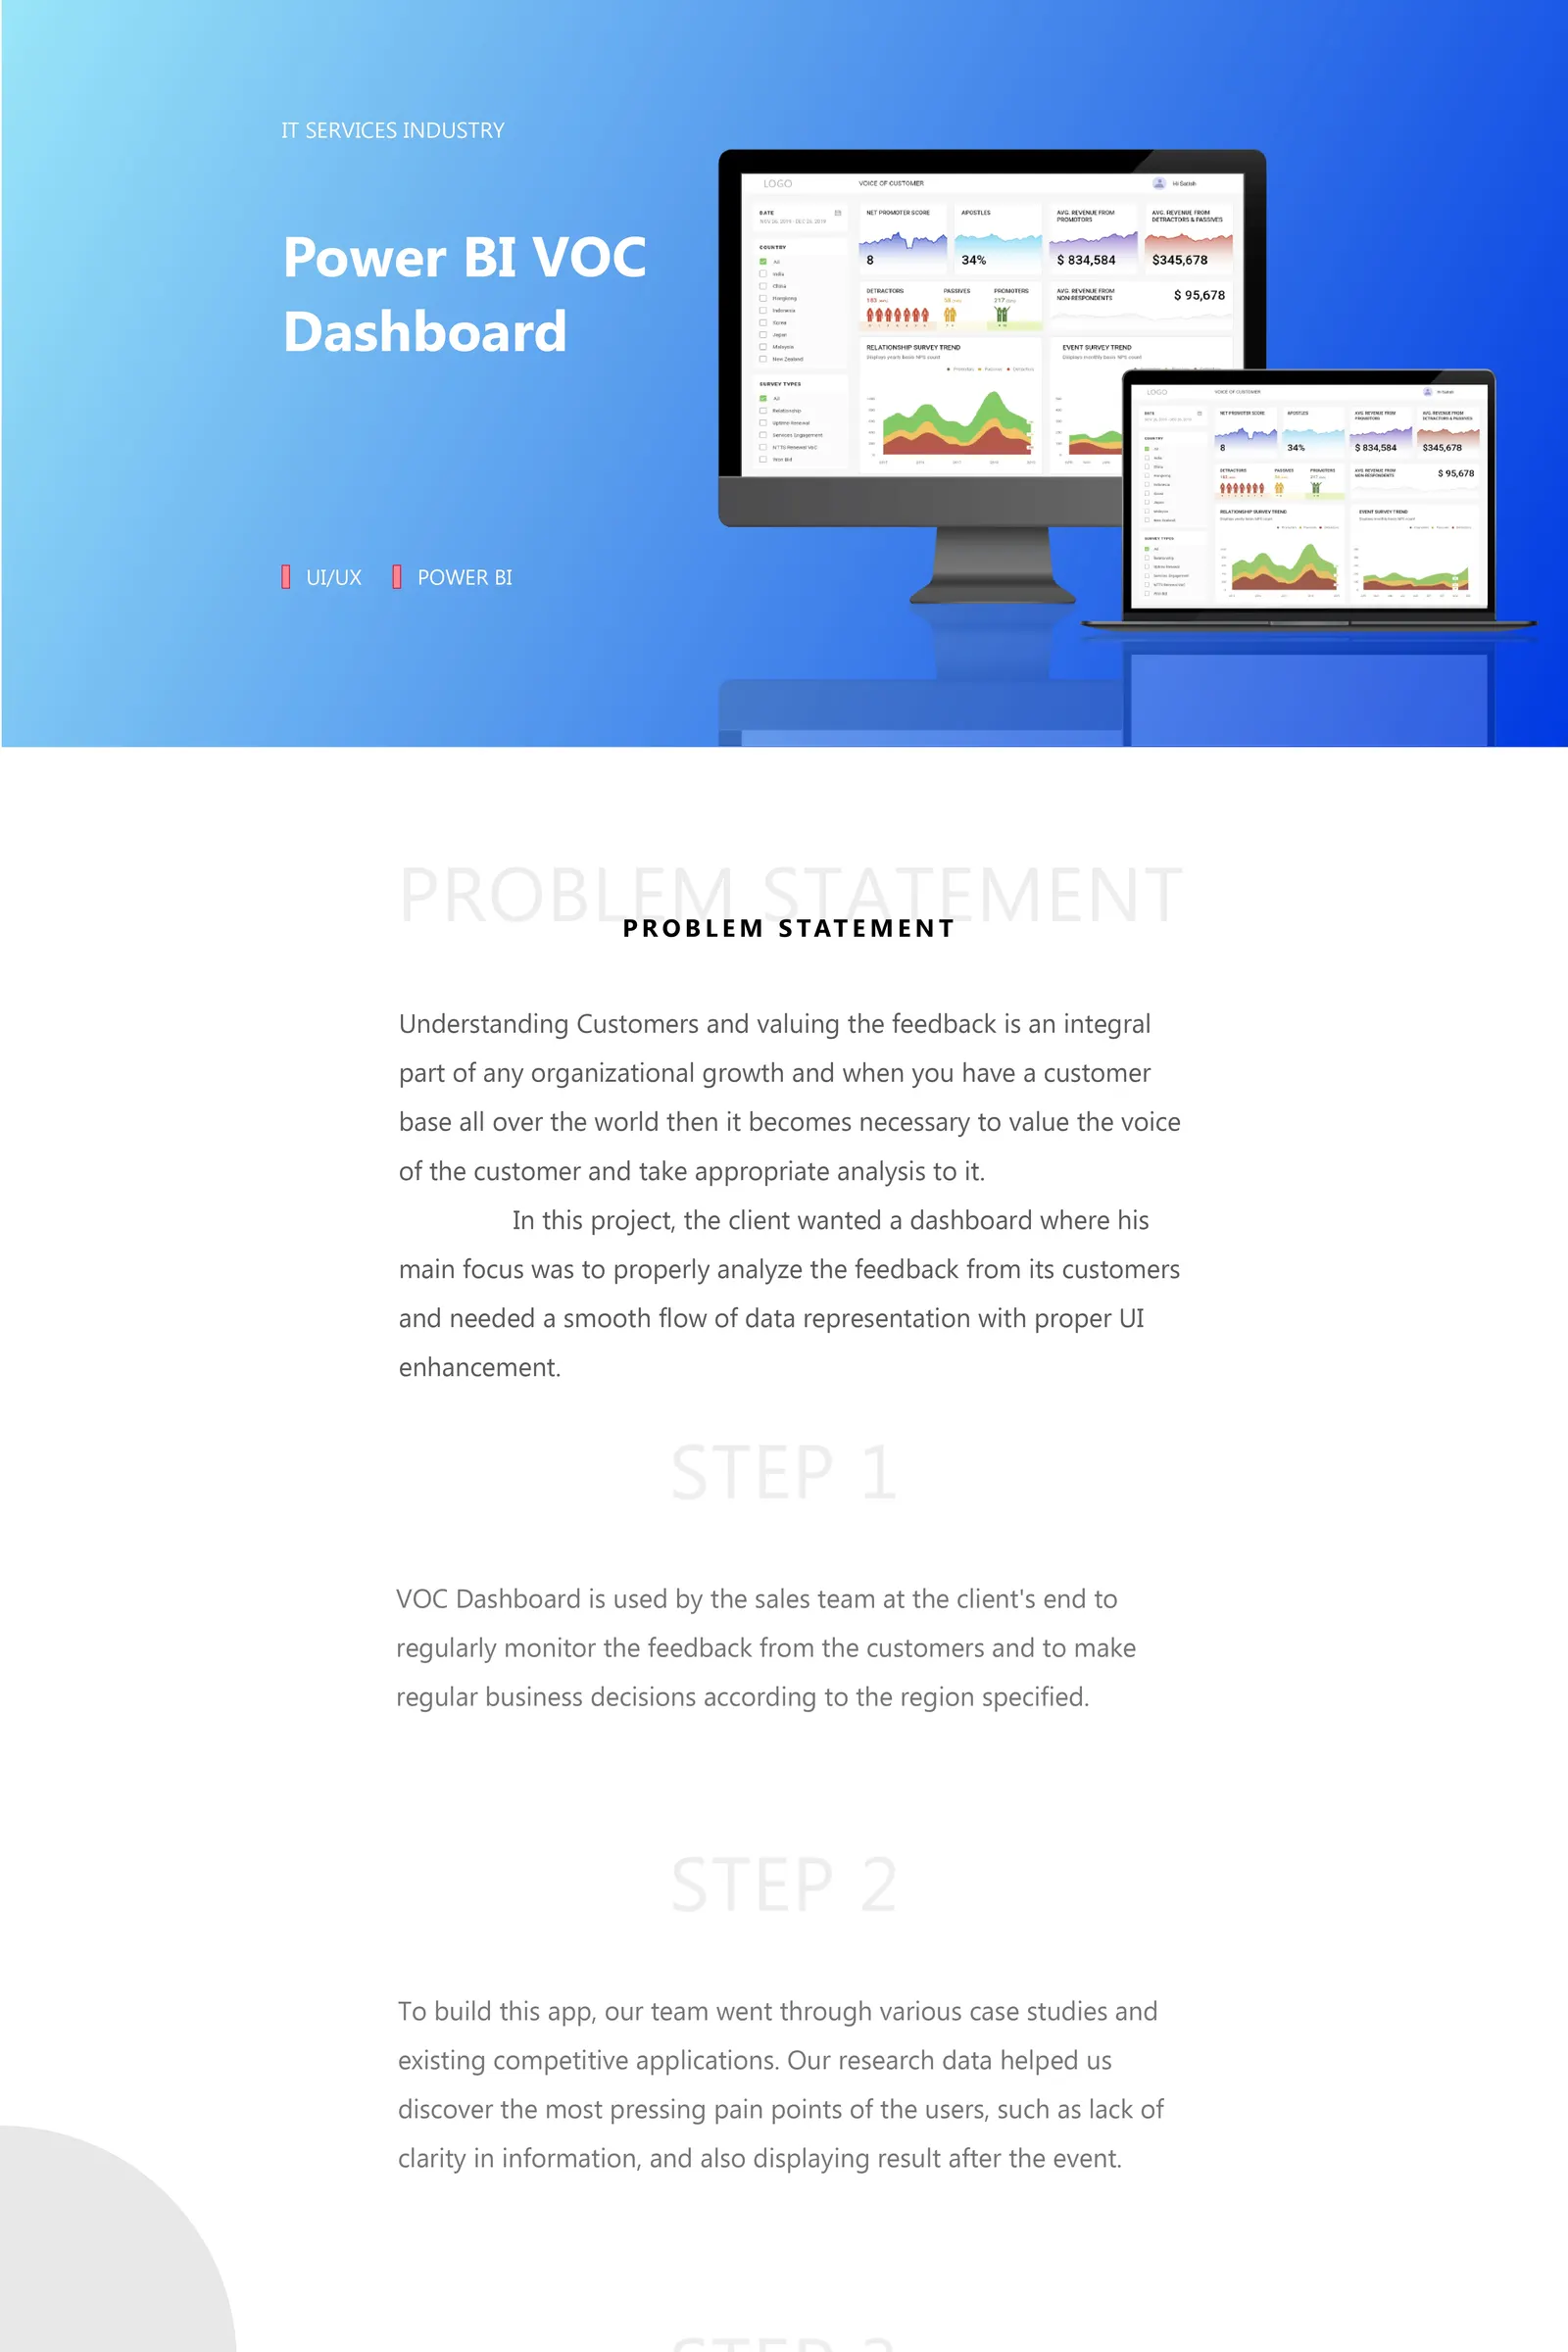
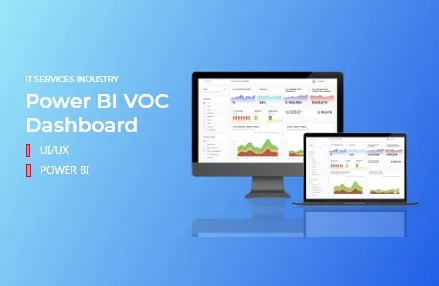
A Power BI dashboard that helps a global sales team act on customer feedback by region.
CoverDashboard
 439 × 286
Overview
Understanding customers and valuing their feedback is key to any organisation’s growth. With customers all over the world, it becomes essential to listen to the voice of the customer and analyse it properly.
The problem
The client, in the IT services industry, wanted a dashboard focused on analysing customer feedback properly. It needed a smooth flow of data and a better UI.
Who it’s for
The client’s sales team uses the dashboard to monitor customer feedback regularly and make business decisions for each region.
Process
- Research: our team studied a range of case studies and competing applications. The research showed users’ biggest pain points: unclear information and results only shown after the event.
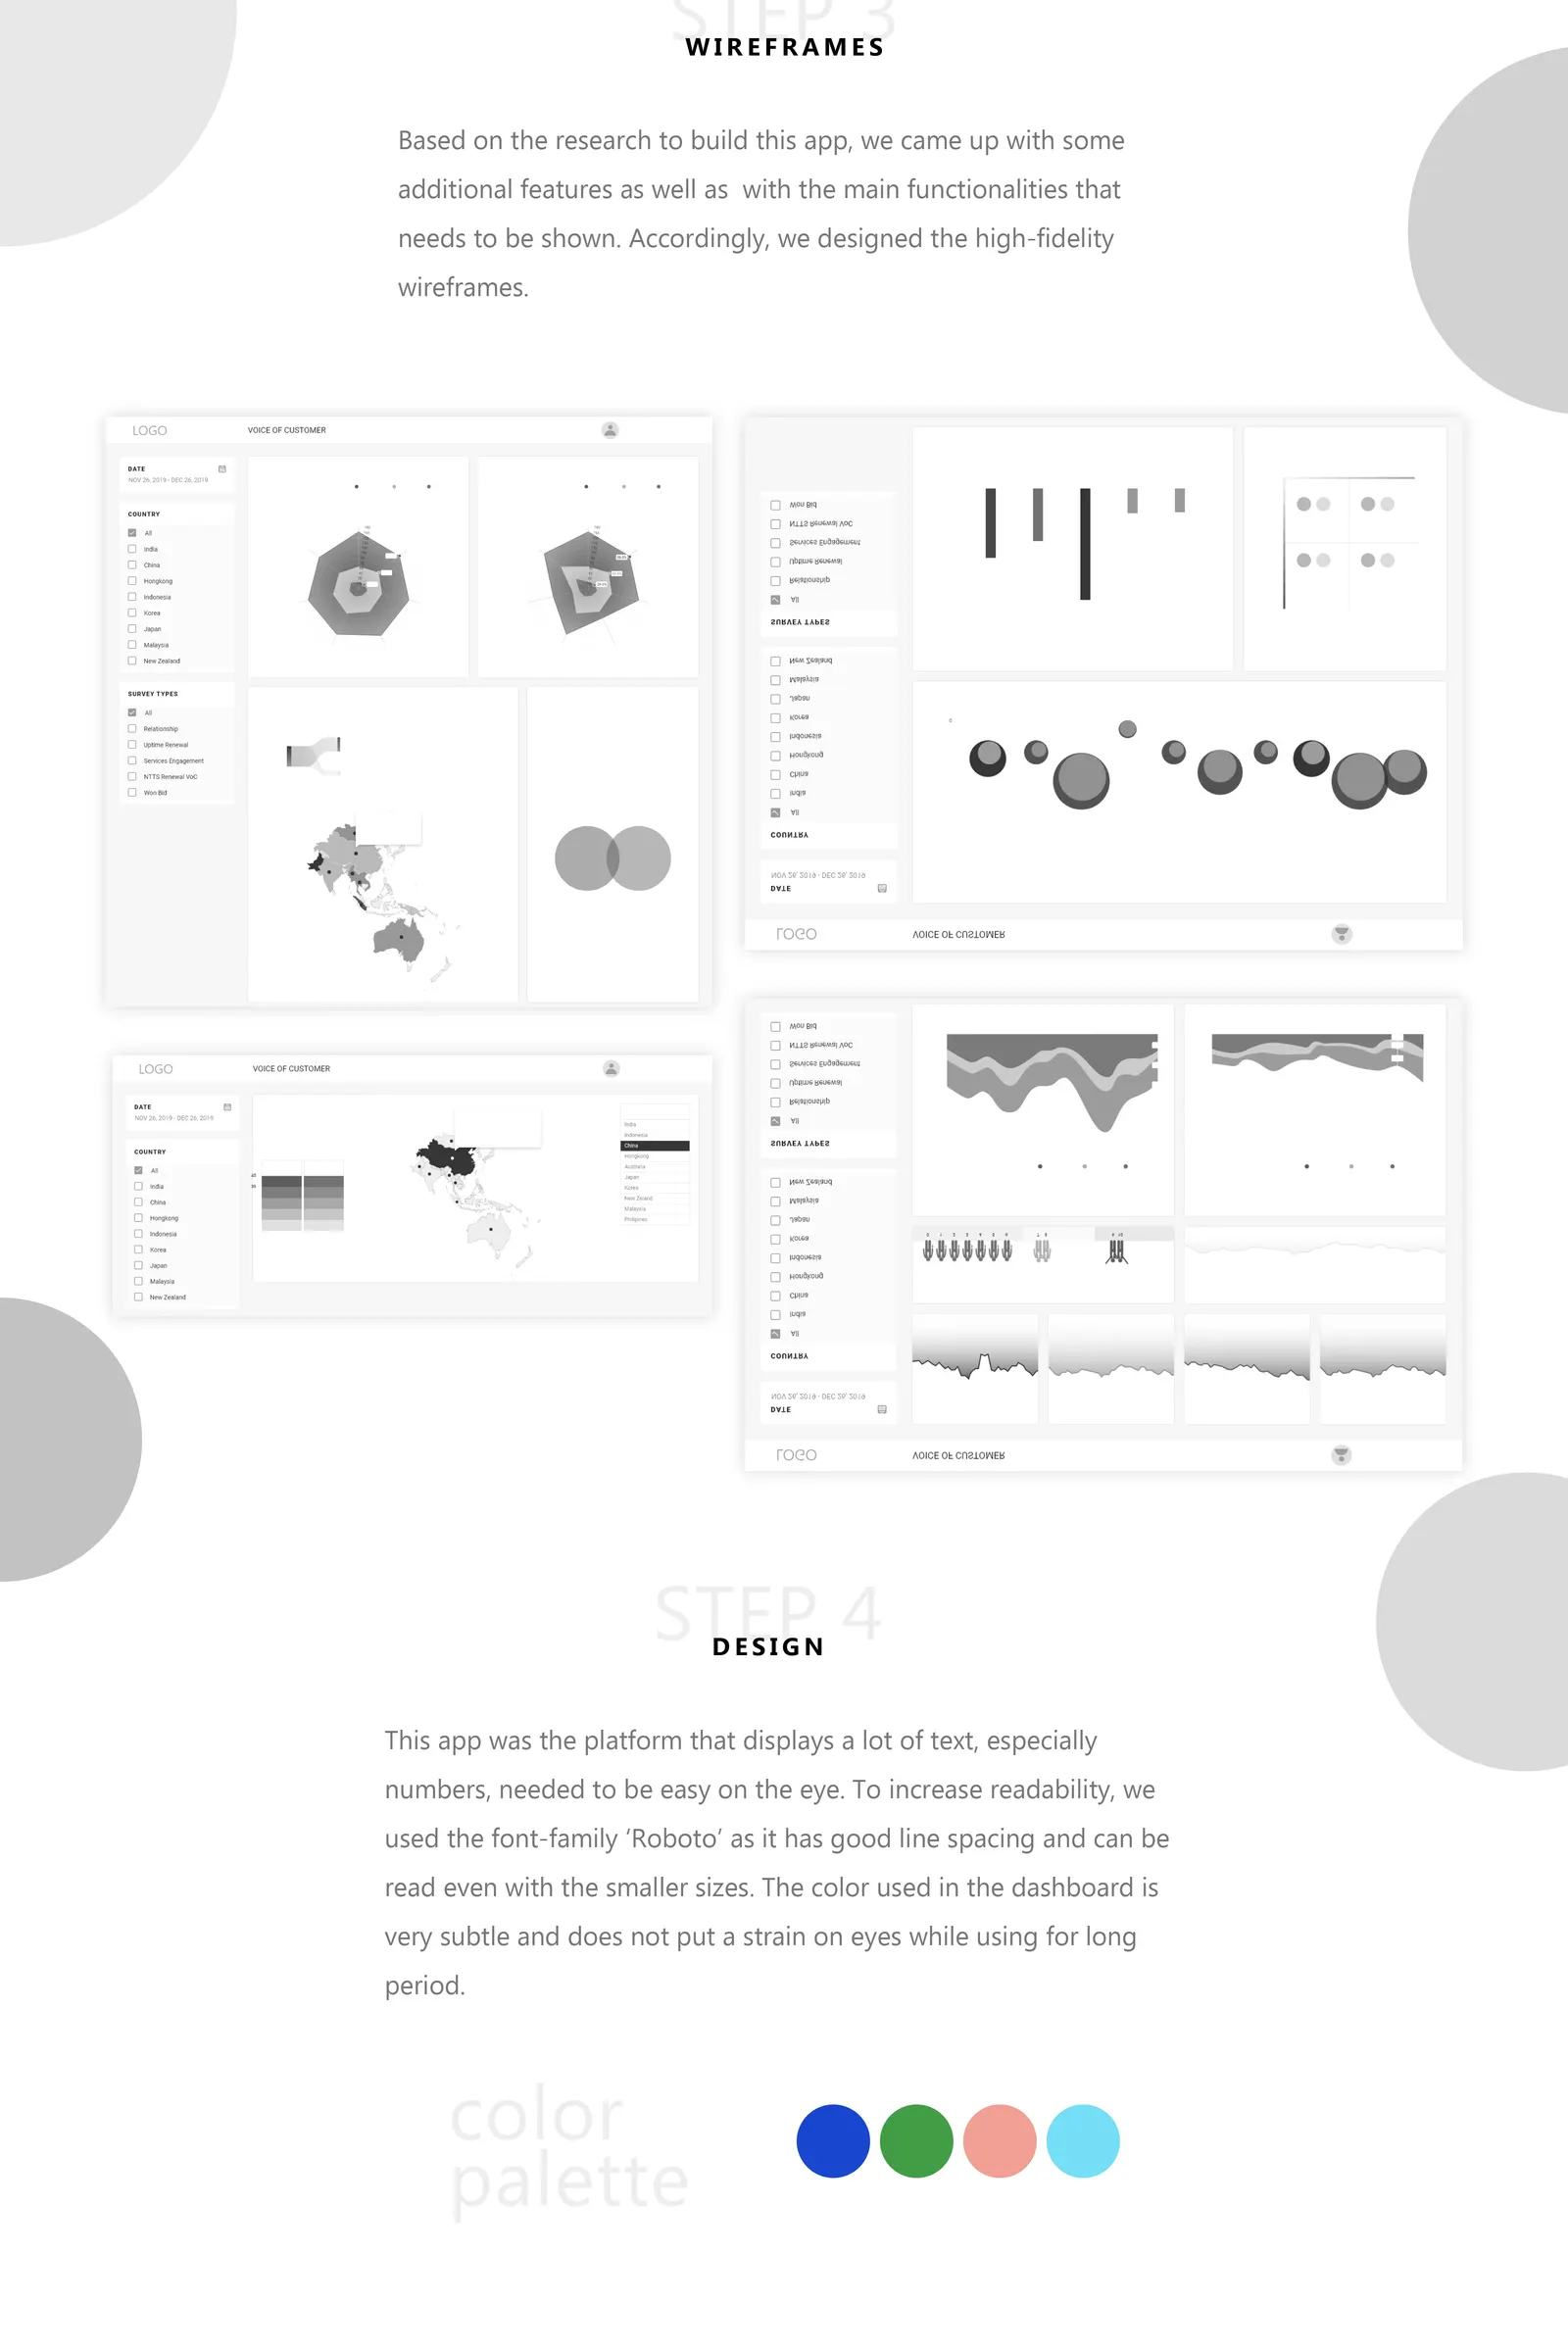
- Wireframes: from the research, we added some extra features alongside the core functions and designed high-fidelity wireframes.
- Design: we turned the wireframes into the final Power BI dashboard.
Key features
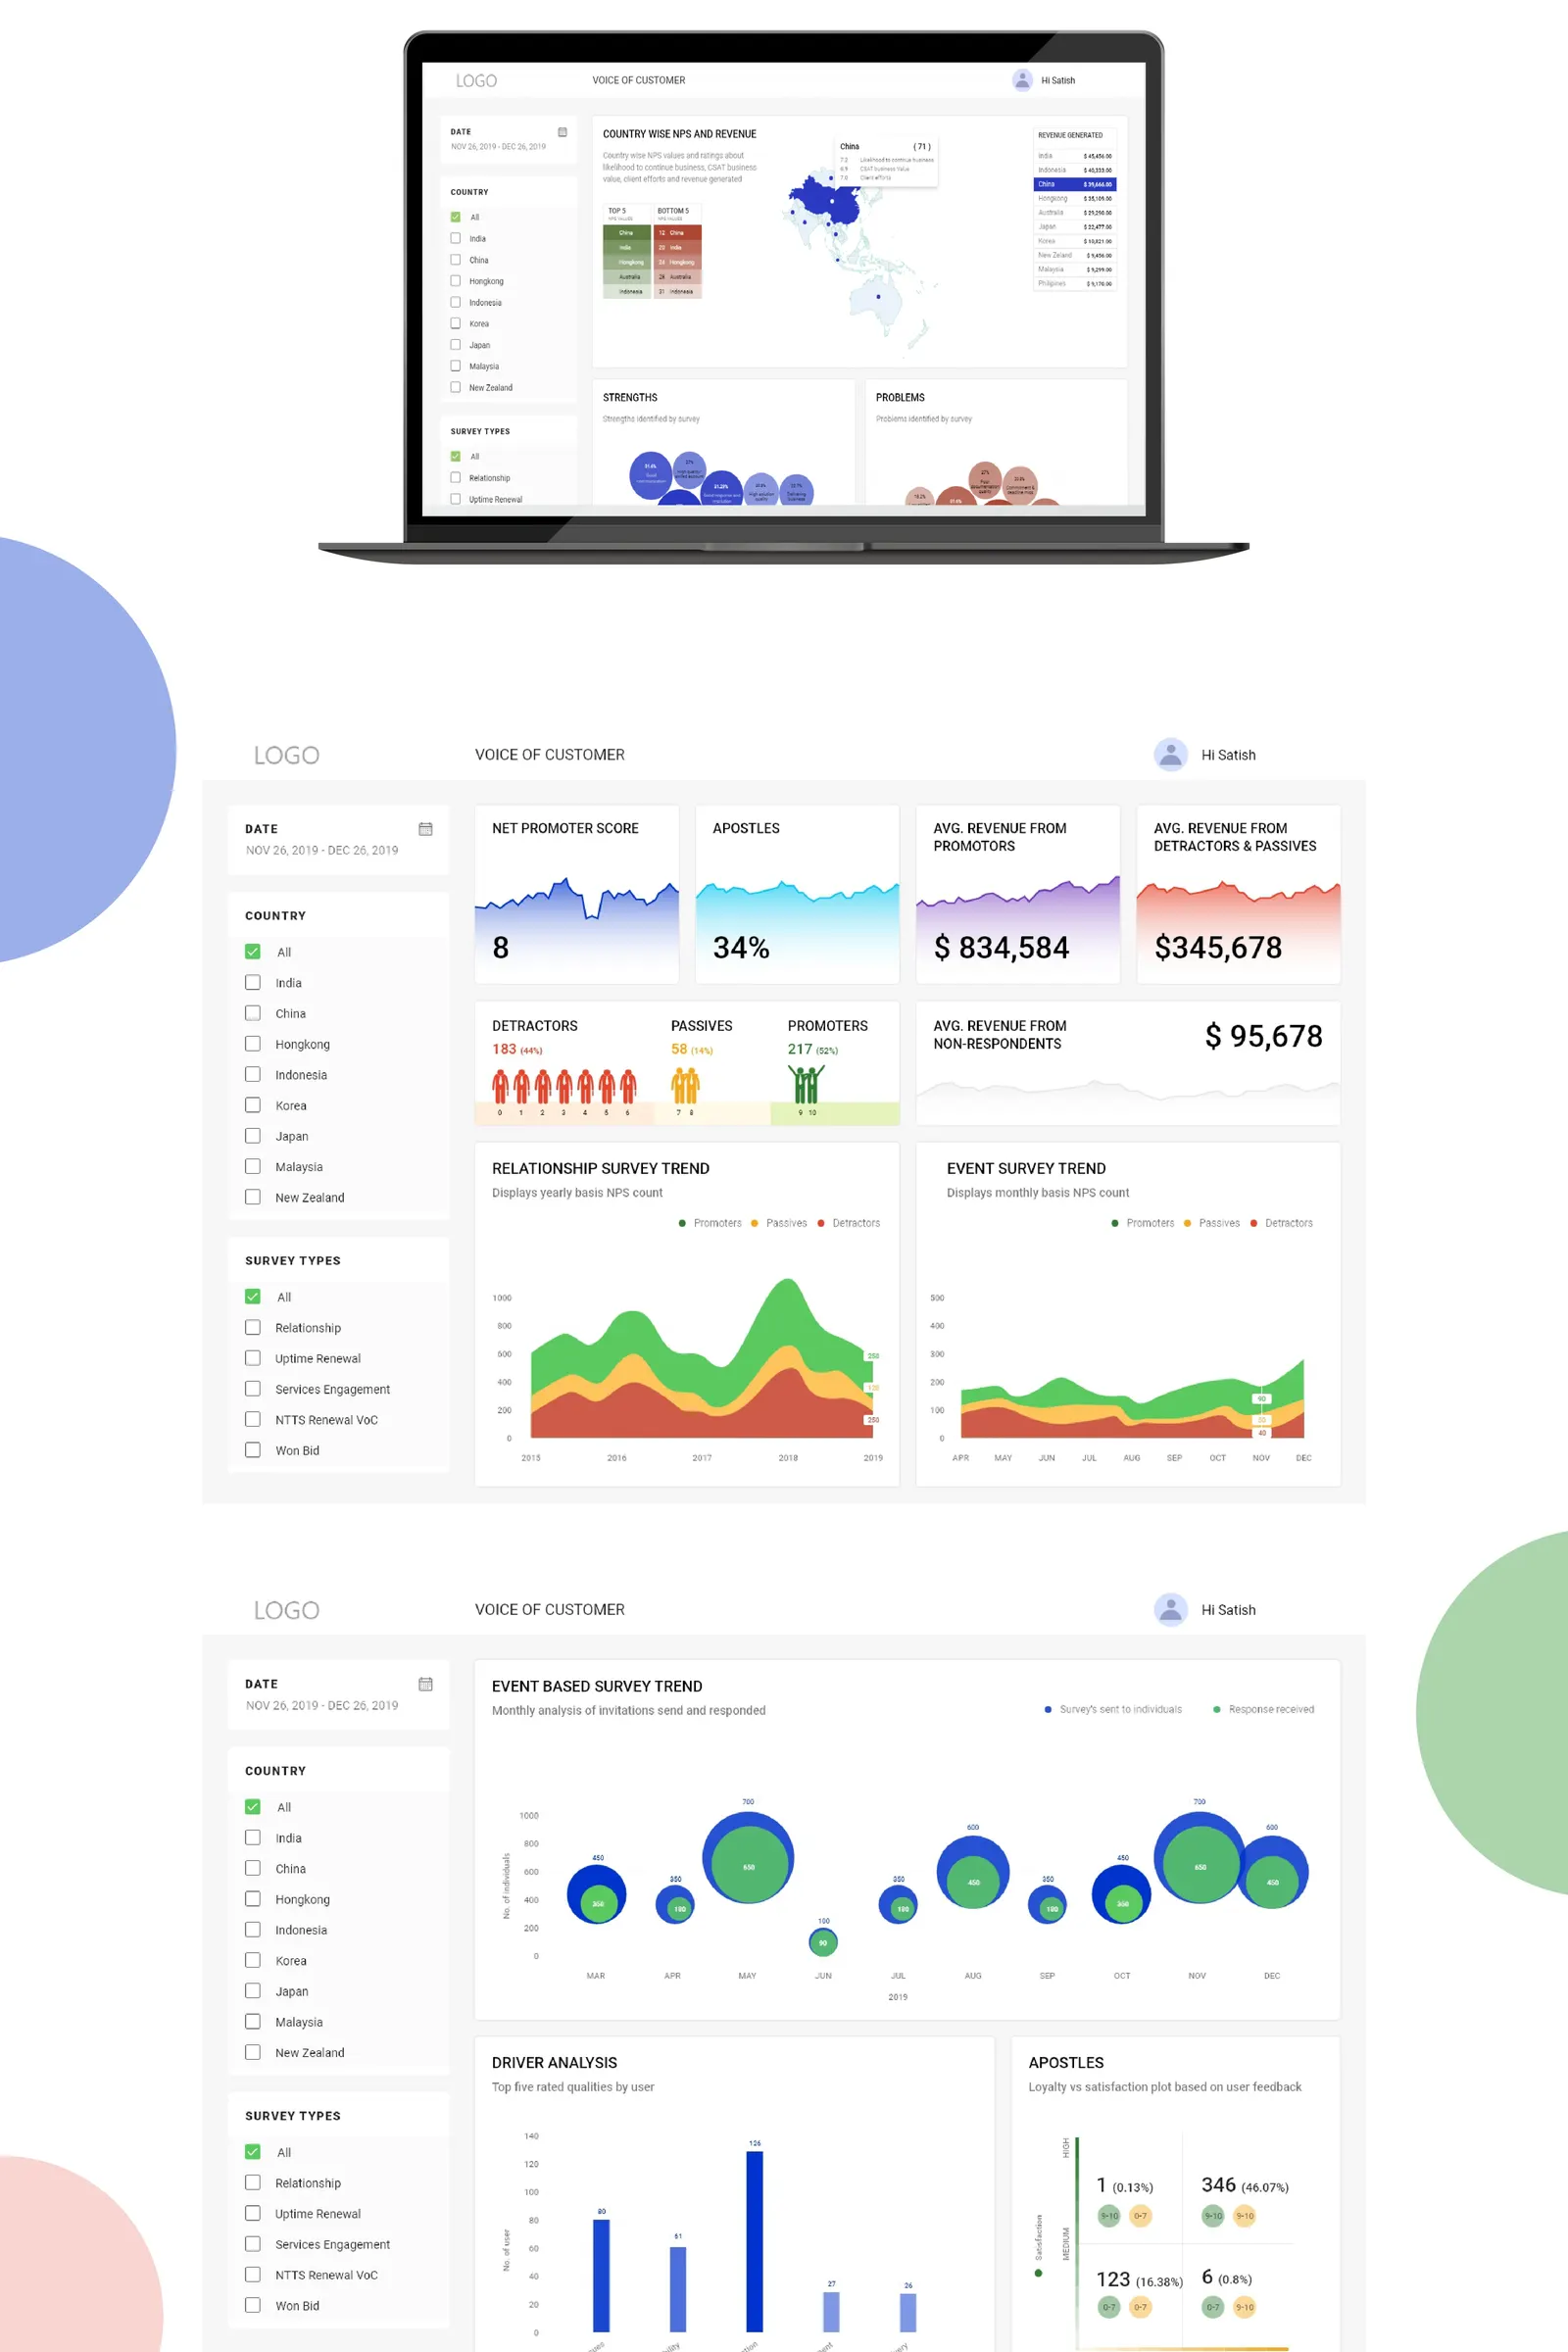
The final dashboard has date, country and survey-type filters. It brings together:
- Net Promoter Score, promoters, passives and detractors, and average revenue by group
- Relationship and event survey trends
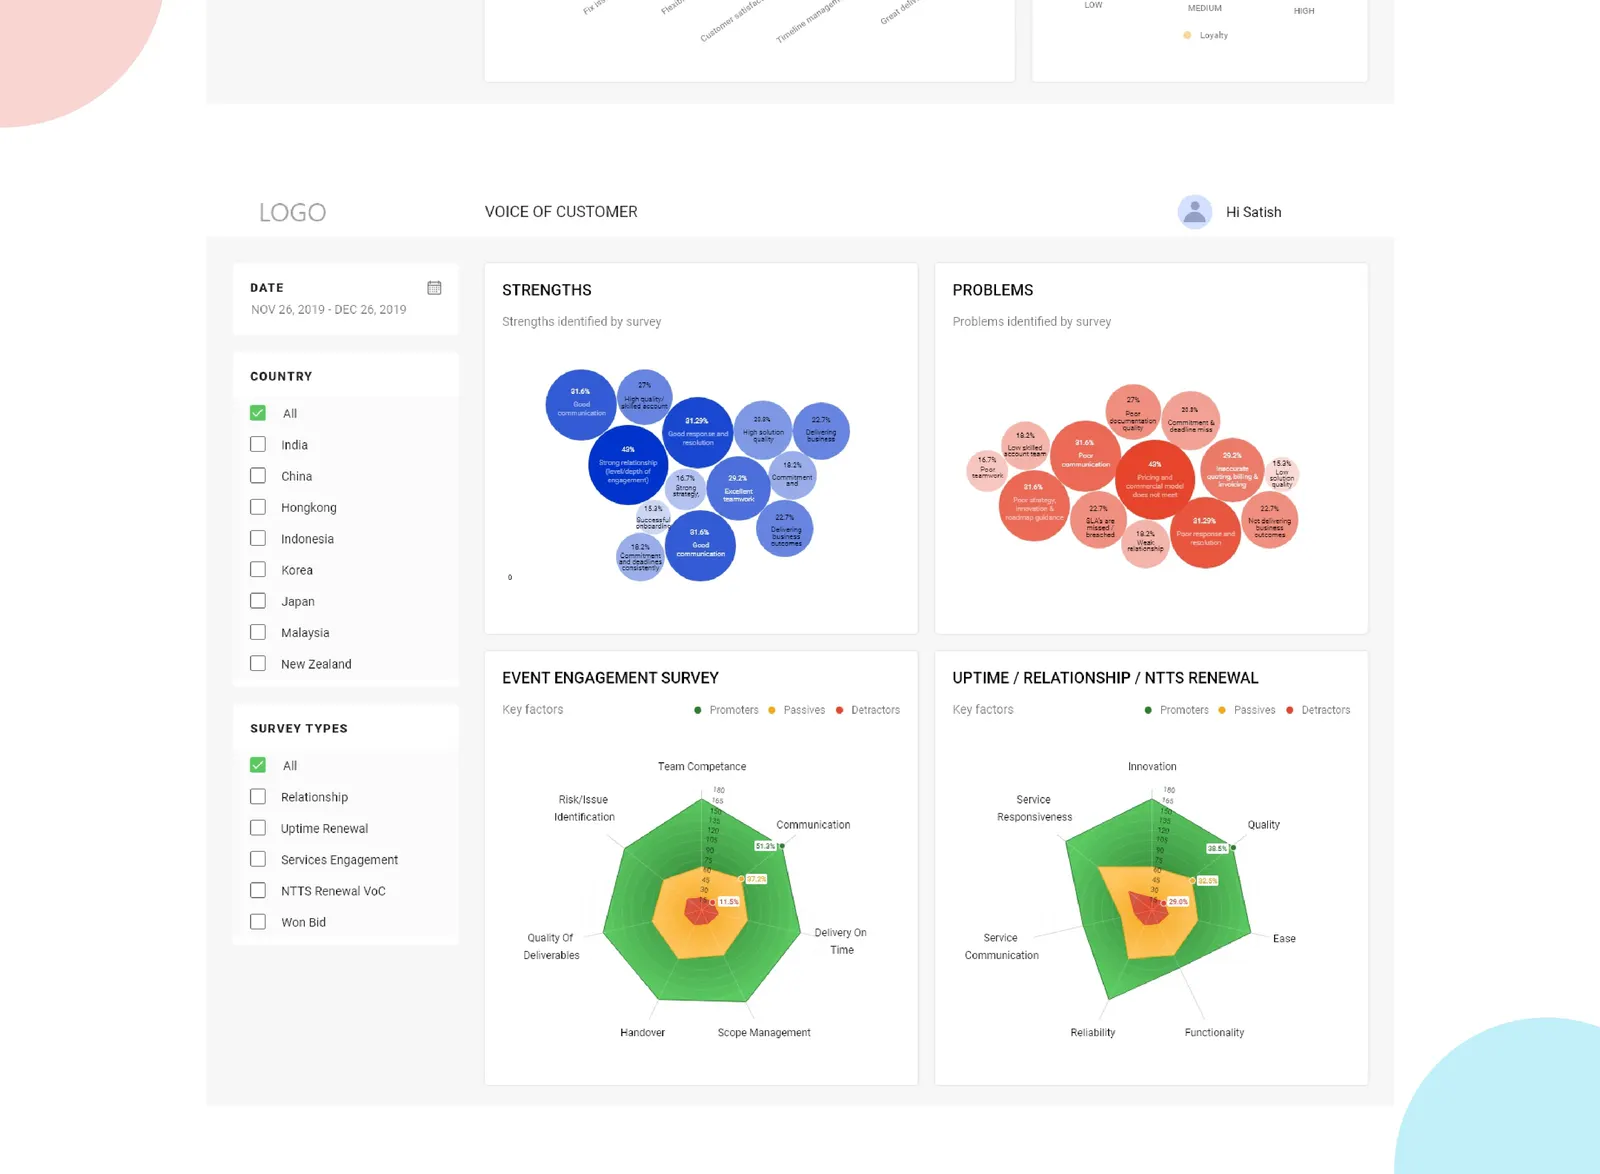
- Country-wise NPS and revenue on a map, with strengths and problems drawn from surveys
- Event-based survey response tracking, driver analysis, and a loyalty-versus-satisfaction plot
Visual design
The dashboard shows a lot of text, especially numbers, so it had to be easy on the eye. We used Roboto because its good line spacing keeps it readable even at small sizes. The colours are deliberately subtle so they don’t strain the eyes during long sessions.
Frame — Boards
Screens & process